Undoubtedly Canton fair is the largest exhibition of China with powerful organizers. The Chinese ministry of commerce and China foreign trade center are organizers of this exhibition. They are the main determiners about the details and publish way. In recent years, Canton fair has been changing it’s policy about publishing statistics. All of these statistics are official and we hope that businessmen and managers benefit from it by accurate and realistic analysis of exhibition.
If you have not been familiar with Canton fair already, you can read following texts to find out how important Canton fair (Guangzhou grand exhibition) is.
Guangzhou, Trade Paradise, Canton Fair
 As an example, the statistics of one of the past courses (period 113 of exhibition) are presented in more details. During this period, a total area of 116000 meters in use with 224746 companies and 59531 booths.
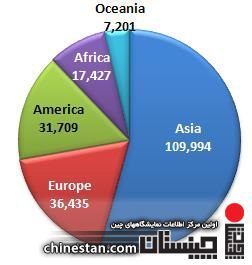
By 7.06% increase from the past period, 202766 foreign visitors from 211 countries visit the exhibition. Top 20 visitor countries includes Hong Kong, United states, India, Russia, Taiwan, Malaysia, Indonesia, Australia, Thailand, Korea and ten other countries with 127882 visitors and 63.77% of all visitors.
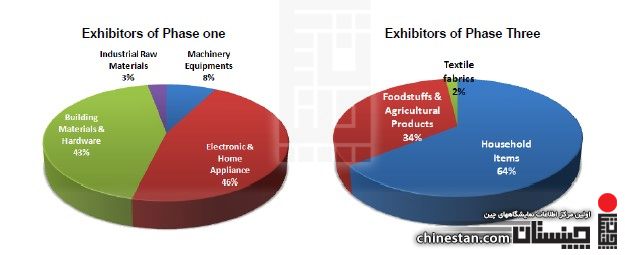
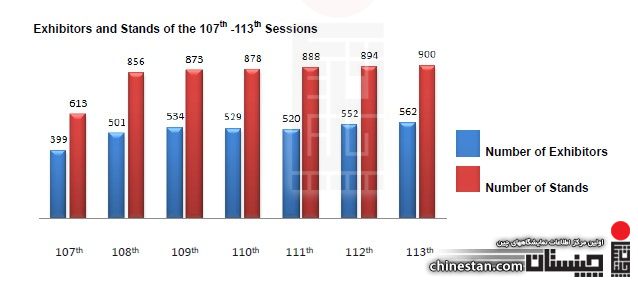
 In the first and third phase of International salon with 7 sections, 900 pavilions participated from 562 companies and 38 countries on total 20000 square meters. 5 countries with most booths in International hall were Korea with 161 companies, Taiwan with 75 companies, India with 70 companies, Malaysia with 65 companies, and Turkey with 50 companies. With field of there works are shown below.
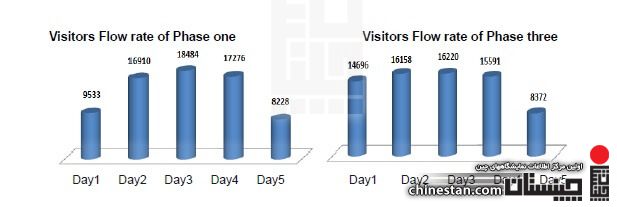
 The visitors of this hall were 36868 people who were 3.2 hours in the first and 2.84 hours in the third phase in first 5 days of exhibition. These visitors had various background and responsibilities that you can see in graphs below.
76% of visitors had experienced this exhibition and 69% of visitors had less than 1 million$ budget to buy.
previous courses in one go
Companies and booths of International hall in recent years
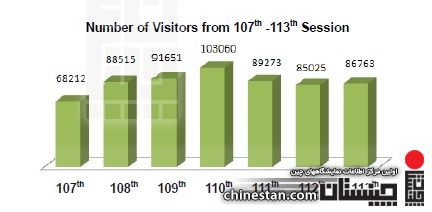
Visitors of international hall in recent years
 Participant statistics of previous Canton fair periods
| Year | Number of foreign buyers | Number of participating countries | ||
| Spring | Fall | Spring | Fall | |
| 2014 | 188,119 | 186,104 | 214 | 211 |
| 2013 | 202,766 | 189,646 | 211 | 212 |
| 2012 | Almost 210,000 | 188,145 | 213 | 211 |
| 2011 | 207,103 | 209,175 | 209 | 210 |
| 2010 | 203,996 | 200,612 | 212 | 208 |
| 2009 | 165,436 | 188,170 | 209 | 212 |
| 2008 | 192,013 | 174,562 | ||
| 2007 | 206,749 | 189,500 | 211 | 213 |
| 2006 | 190,011 | 192,691 | 211 | 212 |
| 2005 | 195,464 | 177,000 | 210 | 210 |
| 2004 | 159,717 | 167,926 | 203 | 203 |
| 2003 | 23,128 | 150,485 | 167 | 201 |
| 2002 | 120,576 | 135,482 | 185 | 191 |
| 2001 | 111,886 | 101,382 | 181 | 176 |
| 2000 | 98,005 | 105,031 | 174 | 174 |
| 1999 | 79,526 | 91,213 | 170 | 174 |
| 1998 | 64,868 | 70,019 | 166 | 165 |
| 1997 | 60,326 | 62,309 | 159 | 165 |
| 1996 | 50,851 | 59,050 | 152 | 151 |
| 1995 | 52,350 | 52,604 | 150 | 167 |
| 1994 | 49,882 | 51,219 | 125 | 142 |
| 1993 | 38,316 | 46,952 | 139 | 141 |
| 1992 | 48,677 | 51,411 | 139 | 132 |
| 1991 | 44,276 | 45,750 | 127 | 129 |
| 1990 | 40,436 | 42,236 | 105 | 117 |
| 1989 | 38,470 | 37,101 | 109 | 98 |
| 1988 | 35,464 | 41,318 | 111 | 102 |
| 1987 | 27,168 | 32,139 | 100 | 114 |
| 1986 | 26,730 | 31,617 | 83 | 96 |
| 1985 | 24,588 | 26,911 | 90 | 87 |
| 1984 | 23,690 | 25,838 | 98 | 92 |
| 1983 | 21,785 | 23,882 | 87 | 84 |
| 1982 | 9,834 | 22,340 | 69 | 92 |
| 1981 | 23,172 | 24,388 | 103 | 92 |
| 1980 | 20,560 | 21,959 | 101 | 94 |
| 1979 | 25,332 | 24,436 | 104 | 97 |
| 1978 | 17,547 | 21,081 | 98 | 97 |
| 1977 | 16,049 | 17,370 | 99 | 94 |
| 1976 | 14,330 | 15,326 | 99 | 92 |
| 1975 | 16,724 | 15,878 | 107 | 110 |
| 1974 | 15,016 | 15,781 | 86 | 88 |
| 1973 | 16,734 | 13,649 | 93 | 85 |
| 1972 | 12,539 | 14,598 | 74 | 82 |
| 1971 | 9,834 | 10,606 | 67 | 70 |
| 1970 | 7,290 | 8,046 | 73 | 57 |
| 1969 | 7,106 | 7,721 | 60 | 63 |
| 1968 | 9,349 | 7,012 | 67 | 65 |
| 1967 | 7,849 | 6,662 | 62 | 60 |
| 1966 | 6,533 | 6,329 | 62 | 52 |
| 1965 | 5,034 | 5,961 | 53 | 56 |
| 1964 | 3,719 | 4,444 | 51 | 51 |
| 1963 | 2,871 | 3,100 | 38 | 42 |
| 1962 | 2,553 | 3,640 | 29 | 36 |
| 1961 | 2,463 | 2,244 | 23 | 31 |
| 1960 | 2,688 | 2,542 | 37 | 31 |
| 1959 | 2,451 | 2,661 | 31 | 31 |
| 1958 | 2,256 | 3,096 | 36 | 40 |
| 1957 | 1,223 | 1,923 | 19 | 33 |
Volume of financial transactions in recent years of Canton fair
| Year | Exchange volume (million dollars) | Amount of transactions of hole year (million dollars) | Change percentage over previous years | |
| Spring | Full | |||
| 2014 | 31,051 | 29,160 | 60,211 | -10.44% |
| 2013 | 35,540 | 31,690 | 67,230 | -2.15% |
| 2012 | 36,030 | 32,680 | 68,710 | -8.09% |
| 2011 | 36,860 | 37,900 | 74,760 | |
| 2010 | 34,300 | |||
| 2009 | 26,230 | 30,470 | 56,700 | -18.7% |
| 2008 | 38,230 | 31,550 | 69,780 | -5.5 |
| 2007 | 36,390 | 37,450 | 73,840 | 11.4 |
| 2006 | 32,220 | 34,060 | 66,280 | 13 |
| 2005 | 29,230 | 29,430 | 58,660 | 13.4 |
| 2004 | 24,510 | 27,200 | 51,710 | 107.5 |
| 2003 | 4, 420 | 20,490 | 24,910 | -29.4 |
| 2002 | 16,850 | 18,470 | 35,320 | 21.2 |
| 2001 | 15,774 | 13,367 | 29,141 | 1.9 |
| 2000 | 13,652 | 14,950 | 28,602 | 17.9 |
| 1999 | 11,551 | 12,728 | 24,279 | 14.5 |
| 1998 | 10,215 | 11,000 | 21,215 | 4.3 |
| 1997 | 9,817 | 10,533 | 20,350 | 9 |
| 1996 | 8,795 | 9,878 | 18,673 | -3.8 |
| 1995 | 10,791 | 8,621 | 19,412 | -8.6 |
| 1994 | 10,152 | 11,085 | 21,237 | 45.2 |
| 1993 | 7,115 | 8,480 | 14,625 | 1.1 |
| 1992 | 6,899 | 7,573 | 14,472 | 12.6 |
| 1991 | 5,743 | 7,106 | 12,849 | 13.2 |
| 1990 | 5,655 | 5,695 | 11,349 | 4.2 |
| 1989 | 4,820 | 5,571 | 10,895 | 13.6 |
| 1988 | 4,648 | 4,944 | 9,592 | 12.3 |
| 1987 | 4,059 | 4,480 | 8,539 | 16.5 |
| 1986 | 3,242 | 4,088 | 7,330 | 29.2 |
| 1985 | 2,573 | 3,103 | 5,676 | 9.5 |
| 1984 | 2,404 | 2,778 | 5,182 | 15.5 |
| 1983 | 2,218 | 2,268 | 4,486 | 61.3 |
| 1982 | 504 | 2,277 | 2,781 | -42 |
| 1981 | 2,063 | 2,735 | 4,798 | 8.9 |
| 1980 | 1,898 | 2,511 | 4,408 | -14.2 |
| 1979 | 2,432 | 2,708 | 5,140 | 18.7 |
| 1978 | 1,883 | 2,448 | 4,332 | 34.1 |
| 1977 | 1,547 | 1,682 | 3,230 | 10.6 |
| 1976 | 1,333 | 1,589 | 2,921 | 9.5 |
| 1975 | 1,247 | 1,420 | 2,667 | 12.8 |
| 1974 | 1,097 | 1,267 | 2,364 | -20.3 |
| 1973 | 1,381 | 1,587 | 2,968 | 58.5 |
| 1972 | 793 | 1,079 | 1,872 | 55.9 |
| 1971 | 505 | 695 | 1,201 | 31.7 |
| 1970 | 403 | 509 | 912 | 19.4 |
| 1969 | 335 | 428 | 764.0 | -12.8 |
| 1968 | 396 | 480 | 876 | 6.4 |
| 1967 | 418 | 406 | 824 | -2 |
| 1966 | 360 | 481 | 840 | 11 |
| 1965 | 325 | 432 | 757 | 44.9 |
| 1964 | 242 | 280 | 522 | 46.1 |
| 1963 | 149 | 209 | 358 | 36.7 |
| 1962 | 117 | 145 | 262 | -3.4 |
| 1961 | 140 | 131 | 271 | 17.5 |
| 1960 | 125 | 105 | 231 | 5 |
| 1959 | 76 | 144 | 220 | -21.3 |
| 1958 | 153 | 126 | 279 | 221.3 |
| 1957 | 18 | 69 | 87 | 1 |
Chart of exchange volume in previous courses of Canton fair
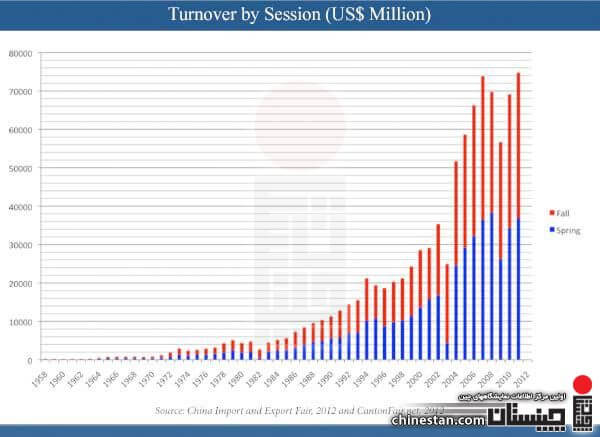
Canton fair was not held in 2010 due to control SARS disease.
